

Aller au contenu
Otek-Soft

BI & Data Visualization

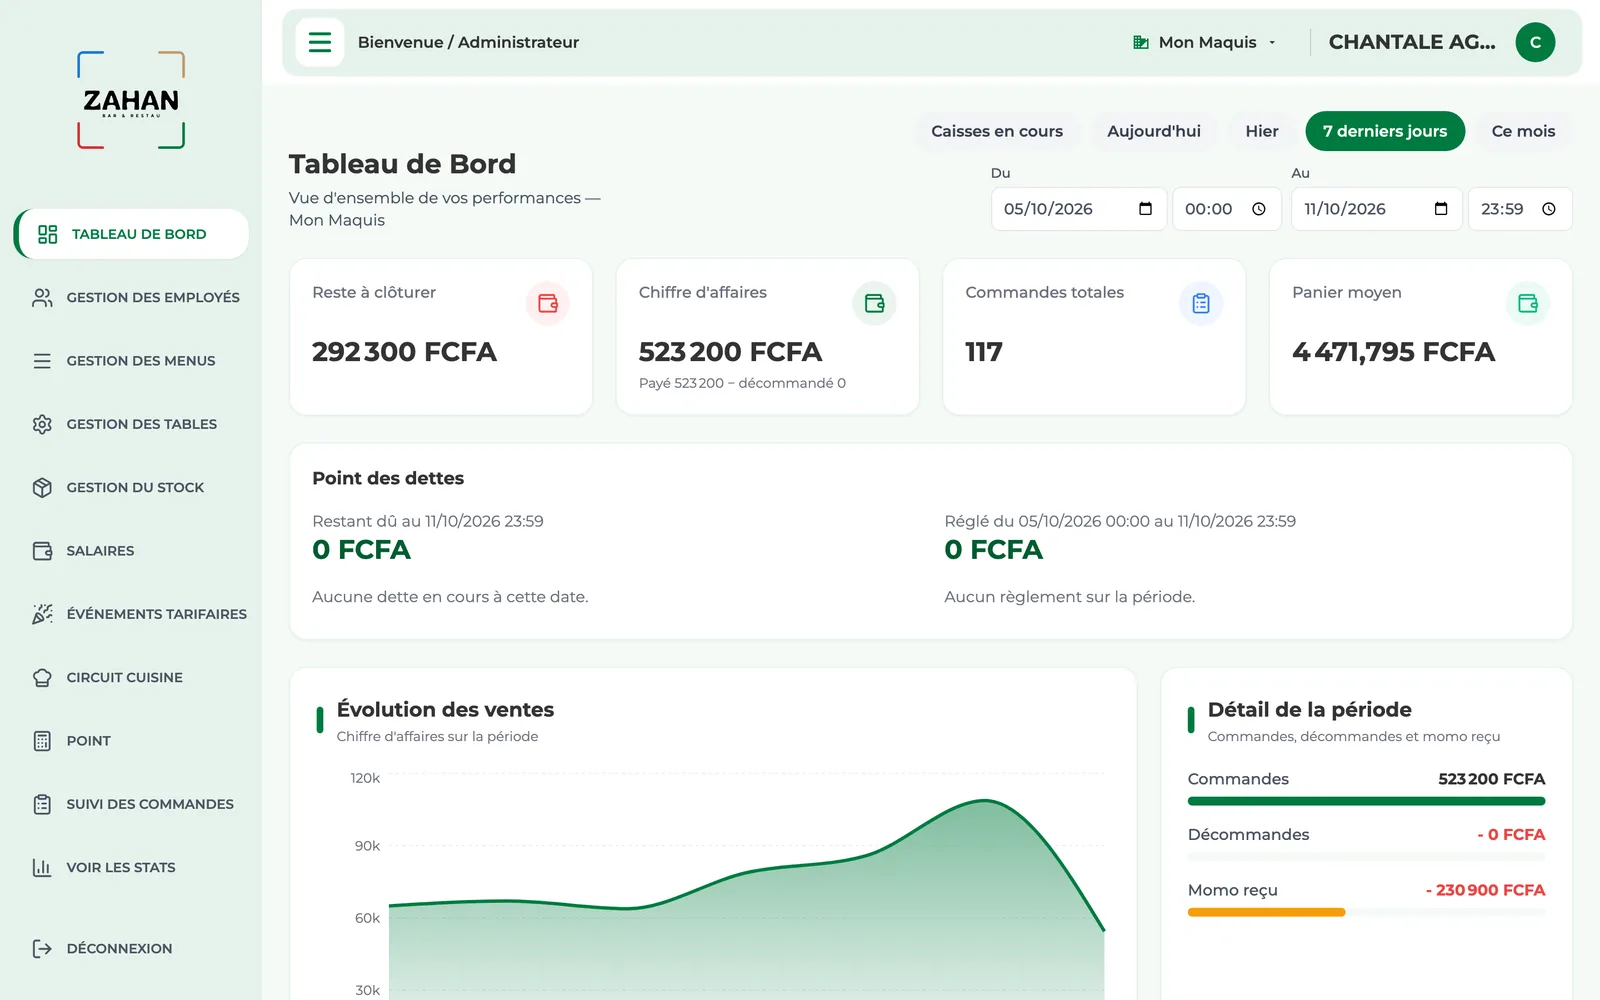
Creation of interactive and visual dashboards to make your data readable and facilitate decision-making.

Concrètement, voici ce que nous prenons en charge.

  1. 01

    Interactive, automatically refreshed dashboards

  2. 02

    Key metrics defined with your teams

  3. 03

    Shareable, exportable reports

  4. 04

    Training users to read the data

Six étapes, et un livrable clair à chacune.

  1. 01

    Decode

    A clear vision and a roadmap

  2. 02

    Design

    Interactive prototype

  3. 03

    Build

    A working solution

  4. 04

    Test

    A reliable, validated solution

  5. 05

    Deploy

    Solution in production

  6. 06

    Evolve

    A solution that keeps improving

Ce que nous avons livré.

Toutes les réalisations